Software

myHDF5
myHDF5 is a free online service to explore and visualize HDF5 files. Users can choose to select files from their local machine, or to load files that are hosted remotely on platforms such as GitHub or Zenodo. myHDF5 is based on H5Web, an HDF5 file viewer and visualisation component library built with React and WebGL, as well as h5wasm, a WebAssembly-powered library for reading HDF5 files from JavaScript.
NeXpy
NeXpy provides a high-level python interface to NeXus data contained within a simple GUI. It is designed to provide an intuitive interactive toolbox allowing users both to access existing NeXus files and to create new NeXus-conforming data structures without expert knowledge of the file format. The underlying Python API for reading and writing NeXus files is provided by the nexusformat package, which is also described here.
OASYS
OASYS (OrAnge SYnchrotron Suite) is an open-source Graphical Environment for optic simulation software packages used in synchrotron facilities, based on [Orange 3](http://orange.biolab.si/orange3/). It includes SHADOWOUI, a port to the [SHADOW](https://github.com/srio/shadow3) ray-tracing code and XOPPY (the Python version of [XOP](http://www.esrf.eu/Instrumentation/software/data-analysis/xop2.4)
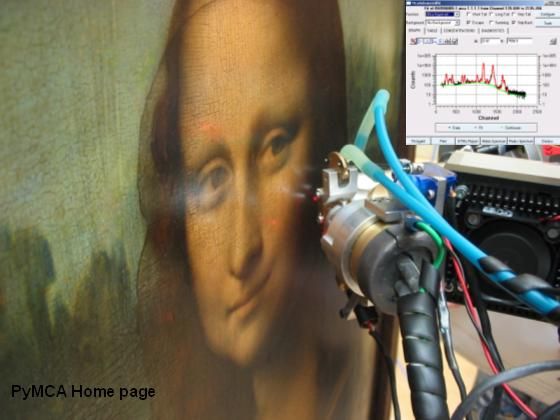
PyMca
X-ray Fluorescence Toolkit (visualization and analysis of energy-dispersive X-ray fluorescence data). . The program allows both interactive and batch processing of large data sets and is particularly well suited for X-ray imaging. Its implementation of a complete description of the M shell is particularly helpful for analysis of data collected at low energies. It features, among many other things, the fundamental parameters method

RFit2000
RFIT2000 fits X-ray and neutron reflectivity data. The search of global minima is done via successive descent from local minima. This method can be treated as a two stage loop repeated consequently. The first stage is the local minimization with the ?2 -like criterion and the second one is the descent from the most recent local minimum. Reflectivity curve is calculated with one of the methods: Kinematic, Parratt and Matrix. Matrix method works faster for films modeled with multiple repetion of one identcal structural units. Film structure is represented with the box model. Each box is characterized with the scattering density (Re and Im), thickness and roughness of the top interface.

silx
The silx project aims at providing a collection of Python packages to support the development of data assessment, reduction and analysis applications at synchrotron radiation facilities. The purpose is to deliver reading/writing of different file formats, data reduction routines and a set of Qt widgets to browse and visualize data.

tomwer
Tomwer is offering tools to automate acquisition and reconstruction processes for Tomography. It contains: - a library to access each acquisition process individually - gui and applications to control main processes (reconstruction, data transfert...) and execute them as a stand alone application. - an orange add-on to help users defining their own workflow (http://orange.biolab.si)

VGStudio MAX
VGStudio MAX is a high-end software for the visualization and analysis of CT data in combination with the optional add-on modules 'Coordinate Measurement', 'Nominal/Actual Comparison', Porosity/Inclusion Analysis', 'Wall Thickness Analysis', 'Fiber Composite Material Analysis' and 'CAD Import (with PMI)',

vscode-h5web
VS Code extension to explore and visualize HDF5 files using the web-based viewer H5Web. H5Web supports the NeXus format.
XOP (includes SHADOWVUI)
XOP (X-ray Oriented Programs) is a widget-based driver program used as a common front-end interface for modelling of x-ray sources characteristics of optical devices (mirror, filters, crystals, multilayers, etc.); multipurpose data visualizations and analyses
- ← Previous
- 1
- 2
- Next →