Software

Avizo
3D analysis software for scientific and industrial data. Different application areas: Materials Science, Quality Assurance in Industrial Environments, Electronics, Digital Rock Analysis etc. It enables users to perform interactive visualization and computation on 3D data sets. The Avizo interface is modelled on the visual programming. Users manipulate data and module components, organized in an interactive graph representation (called Pool), or in a Tree view. Data and modules can be interactively connected together, and controlled with several parameters, creating a visual processing network whose output is displayed in a 3D viewer. With this interface, complex data can be interactively explored and analyzed by applying a controlled sequence of computation and display processes resulting in a meaningful visual representation and associated derived data.

FIT2D
FIT2D is a general purpose 1 and 2 dimensional data analysis program. It is used for both interactive and "batch" data processing, and is used for different purposes. Calibration and correction of detector distortions is one of the main uses of FIT2D. Difficult data analysis problems may be tackled using fitting of user specified models. To enable model fitting to be performed on a wide variety of input data, many other more basic data analysis operations are also available. A wide variety of performant graphical display methods are available.

Pore3D
Pore3D is a software toolbox for quantitative analysis of three-dimensional images. The core of Pore3D consists in a set of state-of-the-art functions and procedures for performing filtering, segmentation, skeletonization and quantitative analysis of three-dimensional data. Although three-dimensional data can be produced by several techniques (for instance: magnetic resonance, x-ray scattering or confocal microscopy), the library was developed and optimized for micro-CT (Computed Tomography) data. Pore3D features are available through the high-level scripting environment IDL. Pore3D has been tested with IDL 64-bit from versions 6.4 to 8.5.
SYRMEP Tomo Project (STP)
SYRMEP Tomo Project (STP) has been developed for the users of the SYRMEP beamline of the Elettra synchrotron facility (http://www.elettra.eu) to perform the digital image processing required by parallel beam propagation-based phase contrast CT experiments. The underlying idea is to let users perform post-beamtime optimization, fine tuning and/or additional tests with common hardware at their home institution. The software has been also developed for teaching and educational purposes. SYRMEP Tomo Project is available only for Windows 64-bit machines.

TOPAS
Profile and structure analysis software for powder and single crystal data XRD. Profile and structure analysis by integrating a large wealth of profile fitting techniques as well as related applications. Single Line Fitting Indexing (LSI and LP-Search methods) Whole Powder Pattern Decomposition (Pawley and Le Bail methods) Ab-initio structure determination in direct space from powder and single crystal data Rietveld structure refinement Quantitative Rietveld analysis

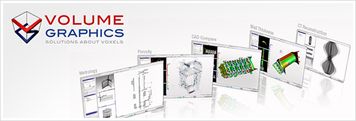
VGStudio MAX
VGStudio MAX is a high-end software for the visualization and analysis of CT data in combination with the optional add-on modules 'Coordinate Measurement', 'Nominal/Actual Comparison', Porosity/Inclusion Analysis', 'Wall Thickness Analysis', 'Fiber Composite Material Analysis' and 'CAD Import (with PMI)',
XRDUA
software package developed by the Antwerp X-ray Imaging/Instrumentation Laboratory (AXiL) at the University of Antwerp. Its main purpose is to automate the processing of two dimensional x-ray diffraction images from scanning micro-XRPD or micro-XRPD tomography. It accepts images from flat area detectors and allows correction, calibration and modeling (Rietveld, Pawley, Pattern Decomposition). The primary goal is to visualize crystalline phase distributions in projection (2D scanning) or in a virtual cross section (tomography) of the object under investigation. Apart from the amount of material, structural properties and their changes within the object can be calculated and visualized as well.
- ← Previous
- 1
- Next →

