Software

ANKAphase
ANKAphase processes X-ray inline phase-contrast radiographs by reconstructing the projected thickness of the object(s) imaged. The tool uses a single-distance non-iterative phase-retrieval algorithm described in a paper by D. Paganin et al. J. Microsc. vol. 206 (2002). It has an easy-to-use graphical user interface and can be run either as a standalone application or as a plugin to ImageJ. It works on powerful clusters but also on your office laptop.
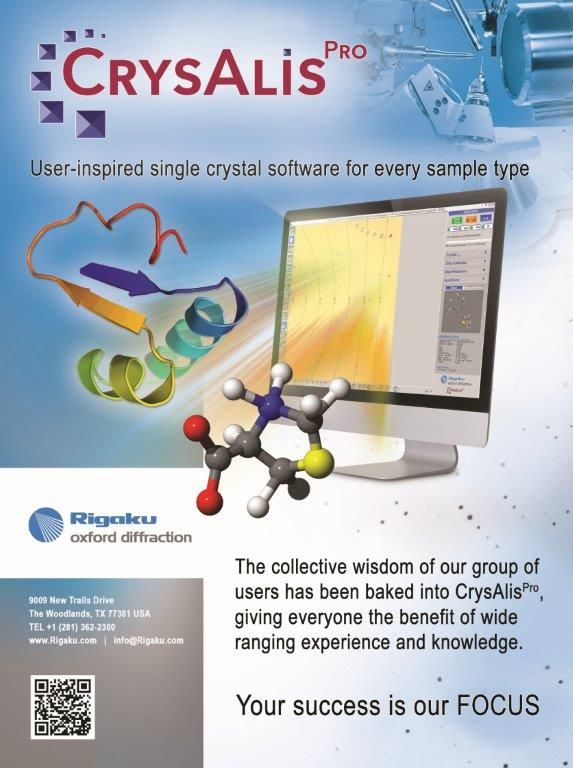
CrysAlis Pro
Data collection and data processing software for small molecule and protein crystallography. Main features: automatic crystal screening, data collection and strategy modules. It provides the user with information regarding the unit cell, intensity estimation by resolution range and suggested frame exposure times for the full data collection.

CSD (CCDC)
The Cambridge Structural Database (CSD) is both a repository and a resource for the three-dimensional structural data of molecules generally containing at least carbon and hydrogen, comprising a wide range of organic, metal-organic and organometallic molecules. The specific entries are complementary to the other crystallographic databases such as the PDB, ICSD and PDF. The data, typically obtained by X-ray crystallography and less frequently by neutron diffraction, and submitted by crystallographers and chemists from around the world, are freely accessible (as deposited by authors) on the Internet via the CSD's parent organization's website (CCDC). ConQuest is the primary program for searching and retrieving information from the CSD.

FabIO
FabIO is a Python library for reading and handling data from 2-D X-ray detectors. FabIO provides a function for reading any image and returning a FabioImage object which contains both metadata (header information) and raw data. All FabioImage objects offer additional methods to extract information about the image and open other detector images from the same data series.
FIT2D
FIT2D is a general purpose 1 and 2 dimensional data analysis program. It is used for both interactive and "batch" data processing, and is used for different purposes. Calibration and correction of detector distortions is one of the main uses of FIT2D. Difficult data analysis problems may be tackled using fitting of user specified models. To enable model fitting to be performed on a wide variety of input data, many other more basic data analysis operations are also available. A wide variety of performant graphical display methods are available.

ICSD
Inorganic Crystal Structure Database, containing about 185,000 peer-reviewed data entries of inorganic and related structures, including their atomic coordinates dating back to 1913. It is produced cooperatively by FIZ Karlsruhe and the National Institute of Standards and Technology (NIST).
MAUD
Materials Analysis Using Diffraction: A Rietveld extended program to perform combined analyses. It can be used to fit diffraction, fluorescence and reflectivity data using X-ray, neutron, TOF or electrons

PyFAI
pyFAI is an azimuthal integration library that tries to be fast (as fast as C and even more using OpenCL and GPU). It is based on histogramming of the 2theta/Q positions of each (center of) pixel weighted by the intensity of each pixel, but parallel version uses a SparseMatrix-DenseVector multiplication

PyHST2
Hybrid distributed code for high speed tomographic reconstruction with iterative reconstruction and a priori knowledge capabilities. PyHST2 (formerly known as PyHST) has been engineered to sustain the high data flow typical of the third generation synchrotron facilities (10 terabytes per experiment) by adopting a distributed and pipelined architecture. The code implements, beside a default filtered backprojection reconstruction, iterative reconstruction techniques with a-priori knowledge. The latter are used to improve the reconstruction quality or in order to reduce the required data volume and reach a given quality goal. The implemented a-priori knowledge techniques are based on the total variation penalisation and a new recently found convex functional which is based on overlapping patches.
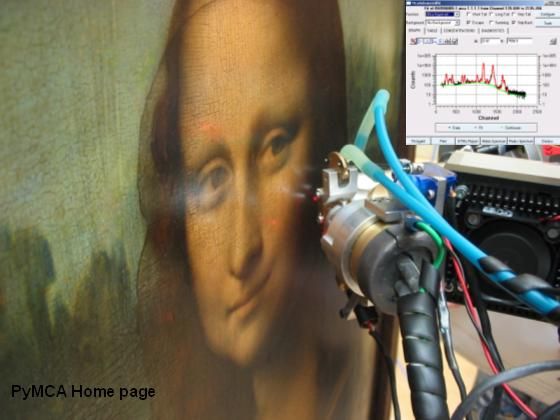
PyMca
X-ray Fluorescence Toolkit (visualization and analysis of energy-dispersive X-ray fluorescence data). . The program allows both interactive and batch processing of large data sets and is particularly well suited for X-ray imaging. Its implementation of a complete description of the M shell is particularly helpful for analysis of data collected at low energies. It features, among many other things, the fundamental parameters method

tomwer
Tomwer is offering tools to automate acquisition and reconstruction processes for Tomography. It contains: - a library to access each acquisition process individually - gui and applications to control main processes (reconstruction, data transfert...) and execute them as a stand alone application. - an orange add-on to help users defining their own workflow (http://orange.biolab.si)
TOPAS
Profile and structure analysis software for powder and single crystal data XRD. Profile and structure analysis by integrating a large wealth of profile fitting techniques as well as related applications. Single Line Fitting Indexing (LSI and LP-Search methods) Whole Powder Pattern Decomposition (Pawley and Le Bail methods) Ab-initio structure determination in direct space from powder and single crystal data Rietveld structure refinement Quantitative Rietveld analysis

XRDUA
software package developed by the Antwerp X-ray Imaging/Instrumentation Laboratory (AXiL) at the University of Antwerp. Its main purpose is to automate the processing of two dimensional x-ray diffraction images from scanning micro-XRPD or micro-XRPD tomography. It accepts images from flat area detectors and allows correction, calibration and modeling (Rietveld, Pawley, Pattern Decomposition). The primary goal is to visualize crystalline phase distributions in projection (2D scanning) or in a virtual cross section (tomography) of the object under investigation. Apart from the amount of material, structural properties and their changes within the object can be calculated and visualized as well.
- ← Previous
- 1
- Next →