Software

Avizo
3D analysis software for scientific and industrial data. Different application areas: Materials Science, Quality Assurance in Industrial Environments, Electronics, Digital Rock Analysis etc. It enables users to perform interactive visualization and computation on 3D data sets. The Avizo interface is modelled on the visual programming. Users manipulate data and module components, organized in an interactive graph representation (called Pool), or in a Tree view. Data and modules can be interactively connected together, and controlled with several parameters, creating a visual processing network whose output is displayed in a 3D viewer. With this interface, complex data can be interactively explored and analyzed by applying a controlled sequence of computation and display processes resulting in a meaningful visual representation and associated derived data.
FEFF9
Condensed matter code for modelling x-ray and electron spectroscopies and materials properties. FEFF is an automated program for ab initio multiple scattering calculations of X-ray Absorption Fine Structure (XAFS), X-ray Absorption Near-Edge Structure (XANES) and various other spectra for clusters of atoms. The code yields scattering amplitudes and phases used in many modern XAFS analysis codes, as well as various other properties. in FEFF9 there are several new spectroscopies which can be calculated with FEFF 9, including electron energy loss spectra (EELS) and non-resonant inelastic x-ray scattering (NRIXS). In addition, there are a variety of improvements. These include; (1) ab initio Debye-Waller factors; (2) improved treatment of inelastic losses; (3) an improved treatment of the core-hole interaction; and (4) more accurate treatment of crystalline systems with k-space calculation of the Green's function. FEFF9 comes with the JFEFF GUI.
FIT2D
FIT2D is a general purpose 1 and 2 dimensional data analysis program. It is used for both interactive and "batch" data processing, and is used for different purposes. Calibration and correction of detector distortions is one of the main uses of FIT2D. Difficult data analysis problems may be tackled using fitting of user specified models. To enable model fitting to be performed on a wide variety of input data, many other more basic data analysis operations are also available. A wide variety of performant graphical display methods are available.
freeart
ART algorithms for fluorescence and transmission tomography reconstructions. Fluorescence absorption for the incoming and outgoing beams are taken into account.

PyFAI
pyFAI is an azimuthal integration library that tries to be fast (as fast as C and even more using OpenCL and GPU). It is based on histogramming of the 2theta/Q positions of each (center of) pixel weighted by the intensity of each pixel, but parallel version uses a SparseMatrix-DenseVector multiplication

PyHST2
Hybrid distributed code for high speed tomographic reconstruction with iterative reconstruction and a priori knowledge capabilities. PyHST2 (formerly known as PyHST) has been engineered to sustain the high data flow typical of the third generation synchrotron facilities (10 terabytes per experiment) by adopting a distributed and pipelined architecture. The code implements, beside a default filtered backprojection reconstruction, iterative reconstruction techniques with a-priori knowledge. The latter are used to improve the reconstruction quality or in order to reduce the required data volume and reach a given quality goal. The implemented a-priori knowledge techniques are based on the total variation penalisation and a new recently found convex functional which is based on overlapping patches.
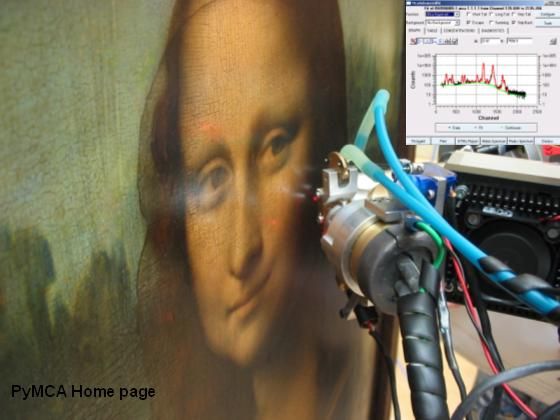
PyMca
X-ray Fluorescence Toolkit (visualization and analysis of energy-dispersive X-ray fluorescence data). . The program allows both interactive and batch processing of large data sets and is particularly well suited for X-ray imaging. Its implementation of a complete description of the M shell is particularly helpful for analysis of data collected at low energies. It features, among many other things, the fundamental parameters method

tomogui
Graphical user interface for tomography reconstruction. Handle - FBP (based on silx FBP) - ART transmission and fluorescence (based on freeart)

tomwer
Tomwer is offering tools to automate acquisition and reconstruction processes for Tomography. It contains: - a library to access each acquisition process individually - gui and applications to control main processes (reconstruction, data transfert...) and execute them as a stand alone application. - an orange add-on to help users defining their own workflow (http://orange.biolab.si)

VGStudio MAX
VGStudio MAX is a high-end software for the visualization and analysis of CT data in combination with the optional add-on modules 'Coordinate Measurement', 'Nominal/Actual Comparison', Porosity/Inclusion Analysis', 'Wall Thickness Analysis', 'Fiber Composite Material Analysis' and 'CAD Import (with PMI)',

xraylib
Quantitative estimate of elemental composition by spectroscopic and imaging techniques using X-ray fluorescence requires the availability of accurate data of X-ray interaction with matter. Although a wide number of computer codes and data sets are reported in literature, none of them is presented in the form of freely available library functions which can be easily included in software applications for X-ray fluorescence. This work presents a compilation of data sets from different published works and an xraylib interface in the form of callable functions. Although the target applications are on X-ray fluorescence, cross sections of interactions like photoionization, coherent scattering and Compton scattering, as well as form factors and anomalous scattering functions, are also available. xraylib provides access to some of the most respected databases of physical data in the field of X-rays. The core of xraylib is a library, written in ANSI C, containing over 40 functions to be used to retrieve data from these databases. This C library can be directly linked with any program written in C, C++ or Objective-C. Furthermore, the xraylib package contains bindings to several popular programming languages: Fortran 2003, Perl, Python, Java, IDL, Lua, Ruby, PHP and .NET, as well as a command-line utility which can be used as a pocket-calculator. Although not officially supported, xraylib has been reported to be useable from within Matlab and LabView. The source code is known to compile and run on the following platforms: Linux, Mac OS X, Solaris, FreeBSD and Windows. It is very likely that xraylib will also work on other platforms: we would be grateful if you would report your successes in this regard. Please note that not all of the bindings are currently working on all platforms. A paper was published concerning xraylib by A. Brunetti, M. Sanchez del Rio, B. Golosio, A. Simionovici and A. Somogyi, “A library for X-ray matter interaction cross sections for X-ray fluorescence applications”, Spectrochimica Acta B 59 (2004) 1725-1731. This paper was recently superseded by a new manuscript, covering all features of xraylib upto version 2.15.0, written by T. Schoonjans, A. Brunetti, B. Golosio, M. Sanchez del Rio, V. A. Solé, C. Ferrero and L. Vincze, named "The xraylib library for X-ray—matter interactions. Recent developments". You are kindly requested to include this paper in the reference list of your published work when you would decide to use xraylib for scientific purposes.

XRDUA
software package developed by the Antwerp X-ray Imaging/Instrumentation Laboratory (AXiL) at the University of Antwerp. Its main purpose is to automate the processing of two dimensional x-ray diffraction images from scanning micro-XRPD or micro-XRPD tomography. It accepts images from flat area detectors and allows correction, calibration and modeling (Rietveld, Pawley, Pattern Decomposition). The primary goal is to visualize crystalline phase distributions in projection (2D scanning) or in a virtual cross section (tomography) of the object under investigation. Apart from the amount of material, structural properties and their changes within the object can be calculated and visualized as well.
- ← Previous
- 1
- Next →