Software
DL_EXCURV (formerly EXCURVE)
Data analysis of EXAFS spectra using the fast spherical wave method. It provides an integrated environment for the analysis of EXAFS spectra while delivering a platform for the fast spherical wave method. The current version is based on this method for single scattering, but uses the method of Lee and Pendry (1975) for the exact polarisation dependent theory. Multiple scattering has options to use several methods. It allows fitting of both background-subtracted, and normalised total absorbance spectra. In the latter case the program calculates the atomic contribution of the spectrum (whole-spectrum fitting). The purpose of the program is to find a structural model of a material which agrees with the available XAFS spectra. This program (without GUI) was formerly called EXCURVE and is the one installed at the ESRF
easyDiffraction
easyDiffraction is scientific software for modelling and analysis of neutron diffraction data, i.e., simulation of diffraction pattern based on structural model and refinement of its parameters. easyDiffraction is similar to crystallographic programs like FullProf, Jana, GSAS, ShelX, etc. However, unlike them, easyDiffraction is based on external crystallographic libraries, such as CrysPy to cover different functionality aspects within a single intuitive and user-friendly graphical interface.
EXtra-data
A Python library for accessing and inspecting data in European XFEL's HDF5 files. European XFEL saves data in multiple HDF5 files with a moderately complex structure. EXtra-data aims to provide a simple interface to access data from a run directory, and conveniently work it in popular Python libraries such as Dask, Xarray and pandas.
EXtra-geom
Python tools to work with geometry information for multi-module detectors at European XFEL, and to use assemble detector data into images.

FabIO
FabIO is a Python library for reading and handling data from 2-D X-ray detectors. FabIO provides a function for reading any image and returning a FabioImage object which contains both metadata (header information) and raw data. All FabioImage objects offer additional methods to extract information about the image and open other detector images from the same data series.
FIT2D
FIT2D is a general purpose 1 and 2 dimensional data analysis program. It is used for both interactive and "batch" data processing, and is used for different purposes. Calibration and correction of detector distortions is one of the main uses of FIT2D. Difficult data analysis problems may be tackled using fitting of user specified models. To enable model fitting to be performed on a wide variety of input data, many other more basic data analysis operations are also available. A wide variety of performant graphical display methods are available.

Fox/ObjCryst++
The FOX program was made for ab initio crystal structure solution from diffraction data (mostly powder diffraction data). Its most interesting features for ab initio structure determination are: * a versatile description of the crystal contents: either isolated atoms , molecules described using a bond length, bond angles and dihedral angles, and polyhedra for inorganic compounds. You can describe your structure by using any combination of groups of atoms, using a chemist's or crystallographer knowledge about the connectivity in your sample to constrain possible solutions.. * an automatic correction for special positions and shared atoms between polyhedra, suitable for global optimization algorithms. * the ability to use simultaneously multiple powder patterns (X-rays, neutrons), as well as single crystal data (e.g. extracted from a powder pattern) * smart global optimization algorithms which can get out of false minima. * a graphical interface (see the screenshots) with a 3D crystal structure view, with live updates during the optimization process.
freesas
Small angle scattering tools … but unlike most others, free and written in Python. The FreeSAS tool suite is licensed under the MIT license.
GENFIT (and SASMOL)
GENFIT is a software tool for analysing small-angle scattering (SAS) data from X-ray (SAXS) or neutron (SANS) experiments. It reads in a set of one-dimensional scattering curves and fits them using different kinds of models. SAS curves calculated from a model can be smeared to allow for the instrumental resolution. The user can fit the experimental data selecting one or more models from a list including more than 30 models, starting from simple asymptotic behaviours (Guinier's law, Porod's law, etc.) down to complete atomic structures. Some models, which are defined in terms of both form and structure factors, take into account the interactions between particles in solution. GENFIT is able to simultaneously fit more SAS curves via a unique model or a mixture of models. In the latter case, some specific model parameters can be shared by any selection of the experimental curves. Model parameters can be related to the experimental chemical-physical conditions (temperature, pressure, concentration, pH, etc.) by means of link functions, which can be freely defined by the user. On the other hand, GENFIT can be used to generate theoretical SAS curves from a given model and/or from the knowledge of the species in solution. It can hence be a useful instrument to find the optimum experimental conditions for a planned SAS experiment. GENFIT is written in Fortran. Versions 2.0 and higher make use of a graphical user interface (GUI) to manage input files and execute the calculations.
GNXAS
The GNXAS package is a computer code for EXAFS data analysis based on multiple-scattering (MS) calculations and a rigorous fitting procedure of the raw experimental data. The main characteristic of the software are: + atomic phase shifts calculations in the muffin-tin approximation based on atom self-consistent relativistic calculations. Account for the neighbors is taken. + Inclusion of inelastic losses through complex Hedin-Lundqvist potential. + Calculation of MS signals associated with two, three, and four atom configurations using advanced algorithms. Use of an advanced fitting procedure that allows: + to fit simultaneously any number of spectra containing any number of edges, + to use directly the raw data without any pre-analysis, + to account for complex background multi-electron excitation features, + to use various model peaks for the pair, triplet and quadruplet distribution functions, including non Gaussian models and extreme cases. In all cases absolute parameters can be fitted, - to treat liquid phase or disordered systems and extract reliable g(r) functions in the short range, - to perform a rigorous statistical error analysis and plot two-dimensional correlation maps, - to provide a flexible scientific tool for EXAFS data analysis where the user has access to every stage of the calculation. - full modularity that makes easy to interface parts of the GNXAS software with other available software.
Grasp
"GRASansP" is a MatlabTM script application designed for the graphical inspection, analysis and reduction of multi-detector data produced by the Small-Angle Neutron Scattering (SANS) instruments of the Institut Laue-Langevin (ILL). GRASansP deals with many of the diverse requirements for analysis and reduction of SANS data using a general set of tools and reduction algorithms. Data from the two ILL SANS instruments, D11 and D22, as well as SANS instruments at some other neutron sources, are currently catered for in the GRASansP package. In principle the architecture and coding of GRASansP combined with the matrix handling abilities, graphics and other advantages of the Matlab™ environment should allow continued development of this software and be able to provide more general aspects of multi-detector and complex data set handling. The drive for producing such a suite of software came from the overwhelming need for a modern, complete and general-purpose package to deal with typical procedures required for analysis of two-dimensional SANS multidetector data. By it’s very nature, two-dimensional data is often best appreciated in a graphical form. The birth of GRASansP came from the need for graphical inspection and ability to be able to quickly process and extract the scattered intensity, I(q), as a function of position on the multidetector (qx,qy) or as a function of sample environment conditions from a series of many measurement runs (e.g. temperature sweep, rocking curve etc.). This, combined with an interest in scientific software development and the abilities of the Matlab™ environment have brought GRASansP into it’s present state.
GROMACS
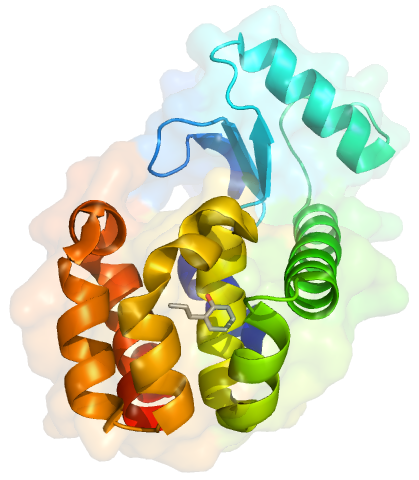
GROMACS (GROningen MAchine for Chemical Simulations) is a molecular dynamics and energy minimization package mainly designed to simulate the Newtonian equations of motion for systems with hundreds to millions of particles, typically of proteins, lipids and nucleic acids. GROMACS can run on CPUs and GPUs.
h5glance
H5Glance lets you conveniently explore HDF5 files in the terminal or an HTML interface, including in Jupyter notebooks.
H5Web
H5Web is a web-based HDF5 file viewer with NeXus support. It allows for the browsing and inspecting of the hierarchical structure of HDF5 files, as well as visualising their datasets as basic plots (1D, 2D). With H5Web, our intent is to provide synchrotron users with an easy-to-use application and to make open-source components available for other similar web applications. H5Web is built with React, a front-end web development library. It supports the exploration of HDF5 files, requested from a separate back-end for modularity (e.g. HSDS, Jupyter, etc.), and the visualisation of datasets using performant WebGL-based visualisations.
ICSD
Inorganic Crystal Structure Database, containing about 185,000 peer-reviewed data entries of inorganic and related structures, including their atomic coordinates dating back to 1913. It is produced cooperatively by FIZ Karlsruhe and the National Institute of Standards and Technology (NIST).
