Software
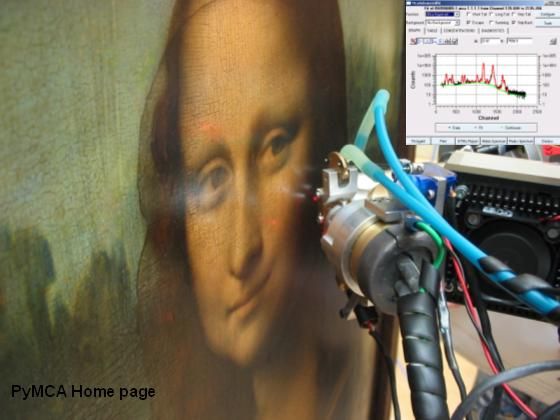
PyMca
X-ray Fluorescence Toolkit (visualization and analysis of energy-dispersive X-ray fluorescence data). . The program allows both interactive and batch processing of large data sets and is particularly well suited for X-ray imaging. Its implementation of a complete description of the M shell is particularly helpful for analysis of data collected at low energies. It features, among many other things, the fundamental parameters method

PyNX
Python toolkit for accelerated Nano-structures Crystallography and Coherent X-ray Imaging techniques. The software included in this package can be used for: 1. the computing of X-ray scattering using graphical processing units 2. X-ray wavefield propagation (from near to far field) 3. simulation and GPU-accelerated analysis of experiments using the ptychography and coherent diffraction imaging techniques See the full documentation at: http://ftp.esrf.fr/pub/scisoft/PyNX/doc/

QENS library
This library provides different building blocks that users can combine, convolute and plug in different frameworks for visualizing or fitting Quasi Elastic Neutron Scattering (QENS) data S(Q, omega). It was developed as part of SINE2020 Workpackage 10 on Data Treatment to develop an exhaustive library of dynamical models in order to increase interoperability and modularity for a rapid prototyping. The models are written in Python for easy integration in workflows. In order to help users, a few examples of data analyses using different standard fitting engines (lmfit, scipy, bumps) are provided as Jupyter notebooks5. Tools are also provided to help those interested in contributing to the project by adding models or sharing examples of data treatment. This project has received funding from the European Union’s Horizon 2020 research and innovation programme under grant agreement No 654000.

REFTIM
The program REFTIM calculates and fits the time spectra of nuclear resonant reflectivity, delayed and prompt reflectivity curves and the corresponding conversion electron Mössbauer spectra (CEMS) for any multilayer structure containing 57Fe, 151Eu, 149Sm, 119Sn or other isotopes if they have M1 Mössbauer transition. The experimental details of the nuclear resonance scattering technique with synchrotron radiation are described in the ID18 beamline Web pages.

RFit2000
RFIT2000 fits X-ray and neutron reflectivity data. The search of global minima is done via successive descent from local minima. This method can be treated as a two stage loop repeated consequently. The first stage is the local minimization with the ?2 -like criterion and the second one is the descent from the most recent local minimum. Reflectivity curve is calculated with one of the methods: Kinematic, Parratt and Matrix. Matrix method works faster for films modeled with multiple repetion of one identcal structural units. Film structure is represented with the box model. Each box is characterized with the scattering density (Re and Im), thickness and roughness of the top interface.

ROD
ROD is a program that can be used to do a refinement of a surface structure using surface X-ray diffraction data. All main features one encounters on surfaces, like roughness, relaxations, reconstructions and multiple domains, are taken into account. The most essential part of ROD is the calculation of the structure factor of the surface. ROD is complemented by two utilities: ANA and AVE: ANA can be used to integrate scans and to convert these into structure factors, while AVE can sort and average data, determine agreement factors and produce a data file for the program ROD.

SASfit
SASfit has been written for analyzing and plotting small angle scattering data. It can calculate integral structural parameters like radius of gyration, scattering invariant, Porod constant. Furthermore it can fit size distributions together with several form factors including different structure factors. Additionally an algorithm has been implemented, which allows to simultaneously fit several scattering curves with a common set of (global) parameters. This last option is especially important in contrast variation experiments or measurements with polarised neutrons. The global fit helps to determine fit parameters unambiguously which by analyzing a single curve would be otherwise strongly correlated.

SasView
SasView is a Small Angle Scattering (SAS) analysis package for the analysis of 1D and 2D scattering data directly in inverse space. The focus was originally on neutron data (SANS) but has been used for X-ray’s as well and includes a tool for determining a slit resolution for the SAXSess instrument. SansView also includes PrView to invert SAS data to P(r), a resolution calculator, and a scattering length density calculator among others tools. A simple plugin mechanism is available for users to add custom models.

SHARP/autoSHARP
SHARP is a computer program for macromolecular crystallography. It operates on reduced, merged and scaled data from SIR(AS), MIR(AS) and MAD experiments, refines the heavy-atom model, helps detect minor or disordered sites using likelihood-based residual maps, and calculates phase probability distributions for all reflections in the data set. autoSHARP is an automated structure solution system - from merged data to automatic model building (uses SHARP as phasing engine).
SHELX
SHELX is a set of programs for the determination of small (SM) and macromolecular (MM) crystal structures by single crystal X-ray and neutron diffraction. In the program suite: SHELXT extracts the Laue group, cell dimensions and types of element present , solves the structure using data expanded to space group P1, and then uses the P1 phases to find the space group. SHELXS solves small (up to about 100 unique non-hydrogen atom) structures by direct methods. it is based on the classical tangent formula of Karle and Hauptman, but uses phase annealing and includes information from the weak reflections via the negative quartets. etc. etc,-> refer to the SHELX home page

silx
The silx project aims at providing a collection of Python packages to support the development of data assessment, reduction and analysis applications at synchrotron radiation facilities. The purpose is to deliver reading/writing of different file formats, data reduction routines and a set of Qt widgets to browse and visualize data.

tomogui
Graphical user interface for tomography reconstruction. Handle - FBP (based on silx FBP) - ART transmission and fluorescence (based on freeart)

tomwer
Tomwer is offering tools to automate acquisition and reconstruction processes for Tomography. It contains: - a library to access each acquisition process individually - gui and applications to control main processes (reconstruction, data transfert...) and execute them as a stand alone application. - an orange add-on to help users defining their own workflow (http://orange.biolab.si)
TOPAS
Profile and structure analysis software for powder and single crystal data XRD. Profile and structure analysis by integrating a large wealth of profile fitting techniques as well as related applications. Single Line Fitting Indexing (LSI and LP-Search methods) Whole Powder Pattern Decomposition (Pawley and Le Bail methods) Ab-initio structure determination in direct space from powder and single crystal data Rietveld structure refinement Quantitative Rietveld analysis
Unscrambler X
Commercial software product for multivariate data analysis, used for calibration of multivariate data which is often in the application of analytical data such as near infrared spectroscopy and Raman spectroscopy, and development of predictive models for use in spectroscopic analysis of materials. Unscrambler X was an early adaptation of the use of partial least squares (PLS). Other techniques supported include principal component analysis (PCA), 3-way PLS, multivariate curve resolution, design of experiments, supervised classification, unsupervised classification and cluster analysis.